Azure Sentinel Internals: Incidents

One day, I will build a playbook that plays ‘Trouble’s coming’ from Royal Blood in our SOC, when a high severity incident is thrown.
In this new blog series, I will dive into several aspects of Azure Sentinel. We will start with ‘Incidents’ – to be more precise: we will concentrate on ‘Scheduled Incidents’.
In my experience, people – due to a lack of knowledge or plain laziness (and I am one of them) sometimes mix-up terms like Events, Alerts, Alarms and Incidents in their conversations. In addition, different tools have different terms for the objects they are displaying in their GUIs. With this article, we will go through all those entities in Sentinel and take a deep dive into their correlations.
Before we can work with Incidents, we need data. Here is an overview of the most important tables in Sentinel and where the data in these tables is coming from (you will find a typical data source and the default connector for this data source in the boxes):

In a later article in this ‘Azure Sentinel Internals’ series, we will cover many of the other tables that are not explained in the picture. For today, the mentioned ones are good to help us understand the incident creation process.
Now that we understand where the most important data exits and where it is coming from, we add some intelligence to it by writing a query:

This query is looking into the OfficeActivity table and specifically for the “Set-Mailbox” value in the column called “Operation”. You find the Schema of the tables above, when you expand them:

We are then filtering out all entries from the ServiceHost and project only the values we need – more about that later.
In the context of an incident, these results are called “events”. When you are working with incidents, you will recognize the events count right away in the incident overview:

When you click on that, you will see the actual results that led to this Incident (well, or alert – we will see):

To trigger this incident, I have modified a mailbox (GrantSendOnBehalf permissions) twice, at 9:42 and at 10:19 which is reflected in the results (events) above.
While setting up the Analytic Rule for the incident, we can decide how to cope with these events:

You can either create an alert for each event (query result) or you can group them into one Alert. The alerts that are being generated are saved in the SecurityAlerts table:
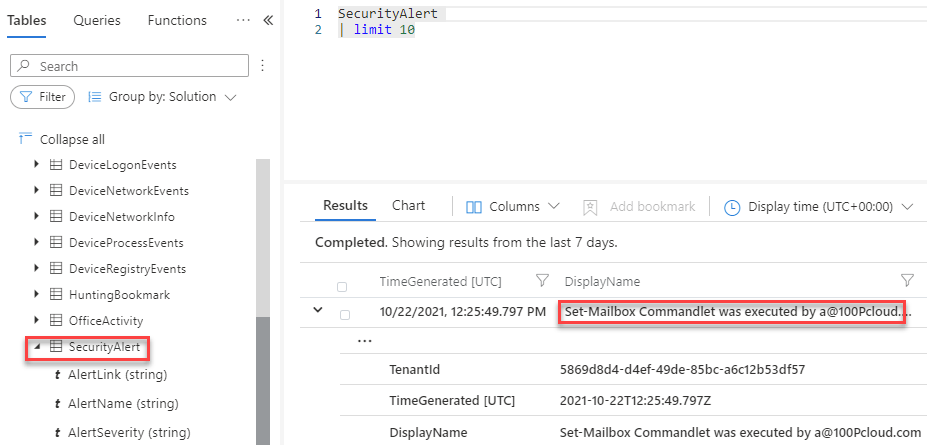
If we would have toggled the “Trigger an alert for each event”, we would only see one event per alert and more alerts. If you disable incident creation in the analytic rule wizard, the alert will be kept in the SecurityAlert table and that is it:
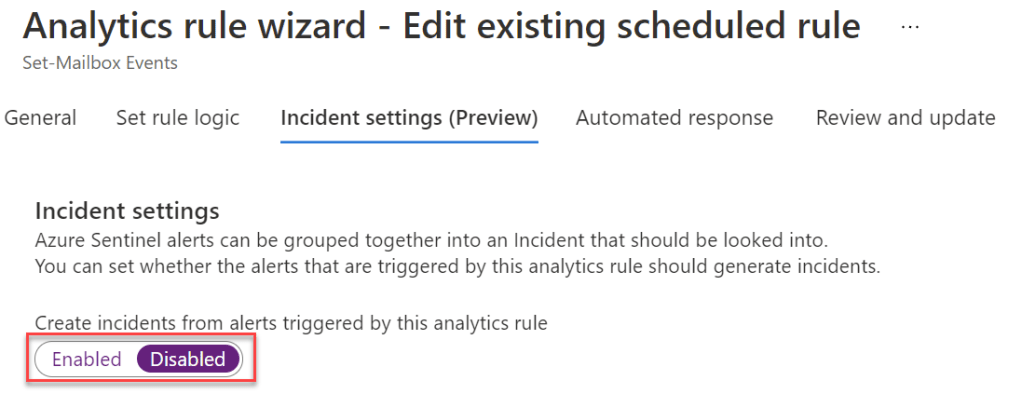
More Interesting Columns in the SecurityAlerts Table
- DisplayName: Set-Mailbox Commandlet was executed by a@100Pcloud.com (dynamic title including username see later how this can be configured)
- AlertName: Set-Mailbox Commandlet was executed by a@100Pcloud.com
- Description: Action took place at 2021-10-21T07:42:30.0000000Z (dynamic timestamp see later how this can be configured)
- Analytic Rule Name: Set-Mailbox Events (associated analytic rule)
- Query: the KQL query we configured above
- Entities: see next chapter
You will then never get an “alarm” -which is not an official term in the Sentinel universe- in any graphical instance of Sentinel by default. It is the Incident that brings the Alert to life!
Incident Creation Details
In the Entity mapping section of the analytic rule wizard, we can map the projected entities of our query to entities of the incident. This is important to give Sentinel the chance to give us some context for an entity and to be able to correlate multiple incidents:
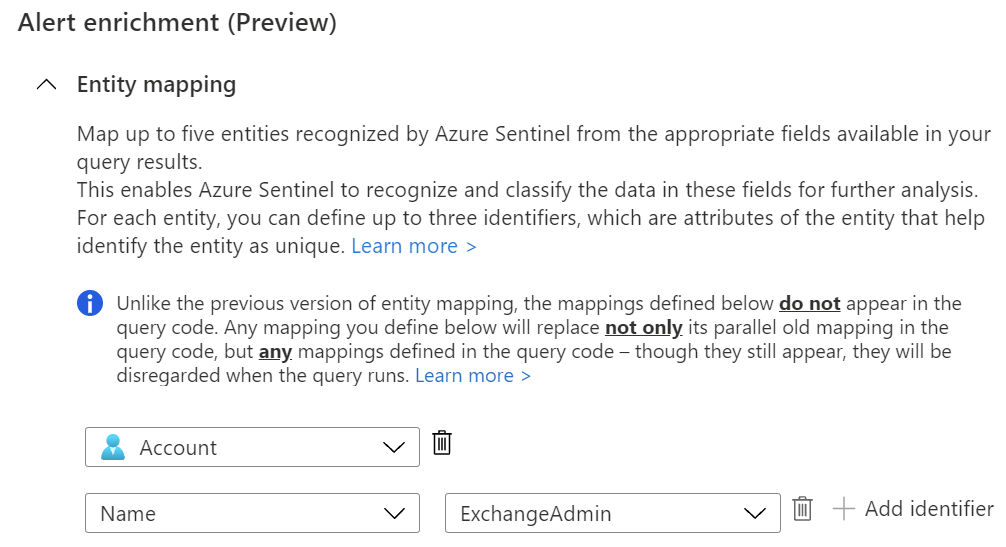
Later, when the incident is triggered, this will result into:

When you click on this entity, Sentinel puts together all the information and insights about this entity it finds:
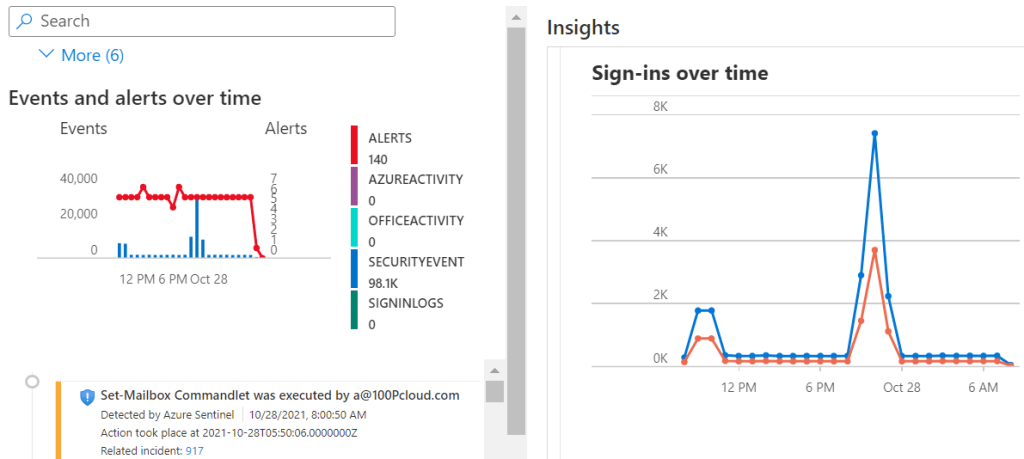
(There is much more information available in the entity page, this is just an example).
The entities are also visible in the investigation view:
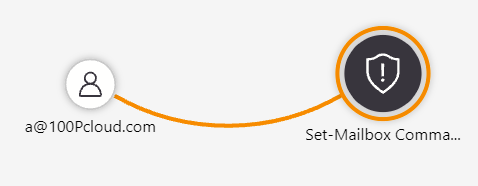
When you are developing detection rules for Sentinel, it is important to think about which entities you want to get extracted from the results.
Custom Details
In the custom details section, we have a chance to map some additional data in the SecurityAlert table:

This setting would result in something, we have seen before:

In the example above, I have just mapped a result from the initial query (the actual command line from the Set-Mailbox command). However, you could do what you like and join in or lookup data from other tables. E.g., you could join the IdentityInfo table and propagate additional information from the admin that executed the command into a custom details field, or you take the DeviceLogonEvents table into account and import information about the machines this admin account has logged into within the last days.
Alert Details
The Alert Details give you more opportunities to provide additional information that is surfaced in the incident:
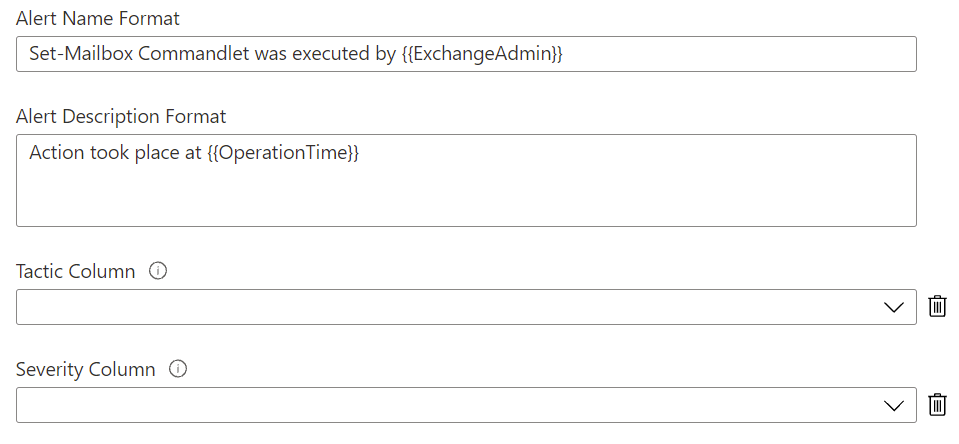
We can work with variables here that can be filled with the entities defined in the query before. The settings above leads to incidents that look like this:
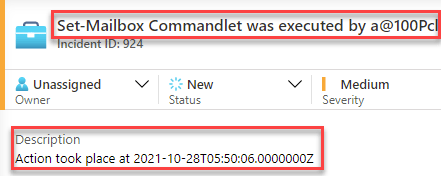
(Make sure you format things like ‘date’ before you project them to avoid date formats as displayed above).
You could also fill the Tactic and Severity Column based on the values you project in the query.
Query Scheduling
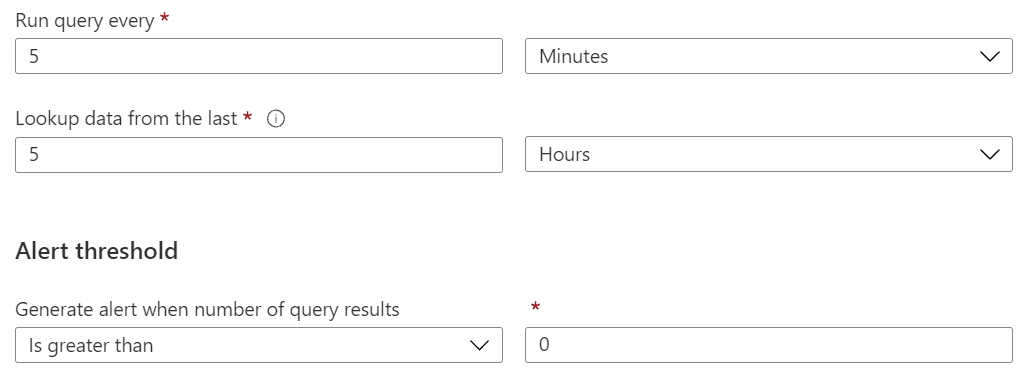
This is quite interesting. To put the settings from the screenshot above into words: the query scheduling above means that our query that is looking for Set-Mailbox operations is run every 5 minutes and is looking for results that have been created (TimeGenerated) within the last 5 hours.
That means, if you modify a mailbox via Set-Mailbox, this modification will produce an alert every 5 minutes for the next 5 hours, so you will get 60 Alerts in the next 5 hours from that:

That is dumb, but it illustrates the behavior of the setting.
In most cases, you will choose the frequency equal to the “look-back” duration to avoid gaps and overlapping.
Alert Grouping
Now, let’s say you need to go with our earlier approach (60 Alerts in 5 hours) for some reason. There is a possibility to group them all into a single incident (at least 150 of them):

A real-life example could be a locked account that is producing a brute force alert because there is an open RDP connection somewhere with a reset password.
But how does Sentinel know how it should distinguish such occurrences that are repeated versus those that are new? This can be set:
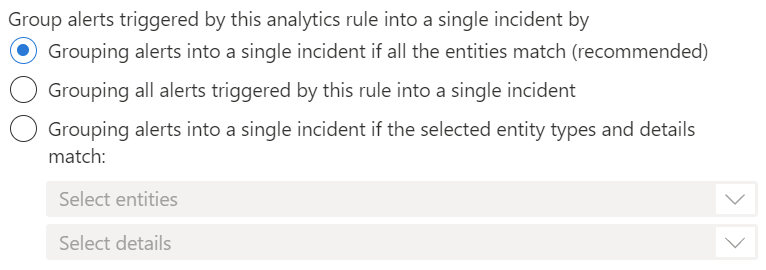
Again, the entities involved in the alert, play an important role. The second option “Grouping all alerts triggered by this rule into a single incident” is also quite interesting. This might mean (depending on the number of alerts produced by the analytic rule) that you always have only one ‘incident-container’ for all analytic rules and each time the rule triggers the incident would just get updated with new alerts.
How you group your events, alerts and incidents is a question of your SOC’s philosophy. However, with the new analytic rule wizard in Sentinel, you have many options to adopt the behavior to your demands.
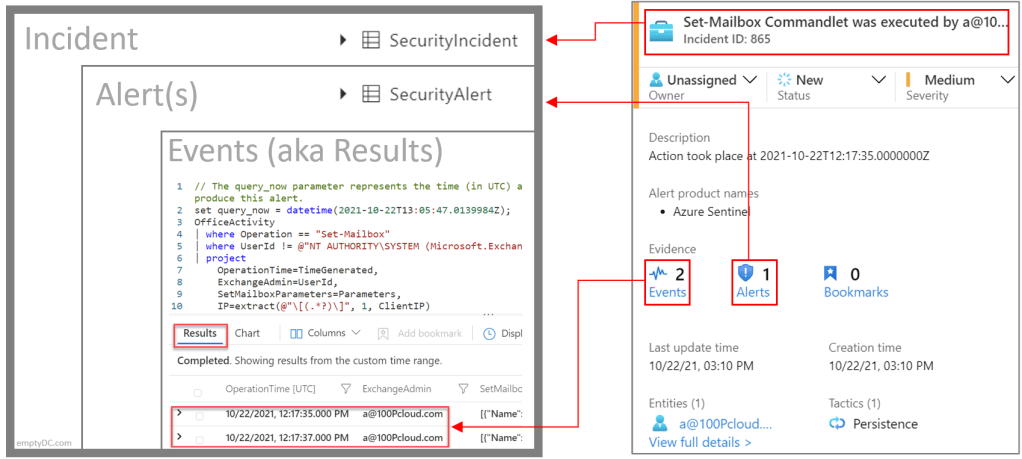
We are coming to the end of this first article. The following picture summarizes the most important terms and relationships we have discussed here:
In the next article, we will investigate some other tables that have not been mentioned this time and into other -non-scheduled- incidents.
Pingback: Week 44 – 2021 – This Week In 4n6