MDE Hunting 101

People that start working with Defender for Endpoint (MDE) often ask the question “where should I start when I see an alert in MDE?”. There is lot of valuable information available in the portal to help judge if an alert is a real incident or a false positive. Additionally, you can query the raw telemetry via KQL. But there is still lot of room for interpretation. So, what should you do to get started? And what is even more important: how do I keep the overview?
Introduction
Before we answer these questions, let’s have a look at the end of this process – with that we will get a clear picture of the goal we are trying to achieve:
At the end, you need to tell a story.
The process of creating this story, writing it down, is like carving a shape from stone. At the beginning, you can only vaguely percept how it will look at the end, but during the process, the contours of the figure become clearer.
And like with all stories, the most important ingredients of an incident story are the ‘characters’. This story will describe what happened in a specific timeframe to these ‘characters’ and how they behaved. We call this character’s ‘entities’:
- Identities
- Devices
- Processes
- Files
- Mailbox
(There might be more entities than the ones mentioned but let us keep it simple for the sake of this post).
Like in any delightful story, these entities have characteristics which we call ‘properties’:
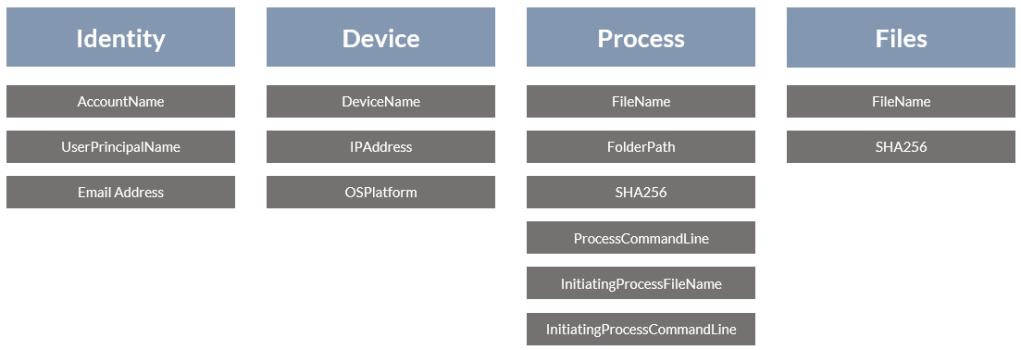
And you find them of course in the KQL Schema of Defender:
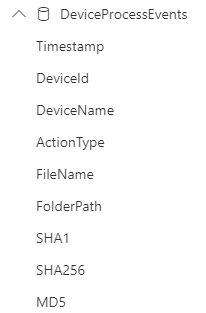
To learn more about the entities however, we are interested in the relationships between them and with that – with ENTITIES, PROPERTIES & their RELATIONSHIPS, we have the structure, the skeleton of our story board:
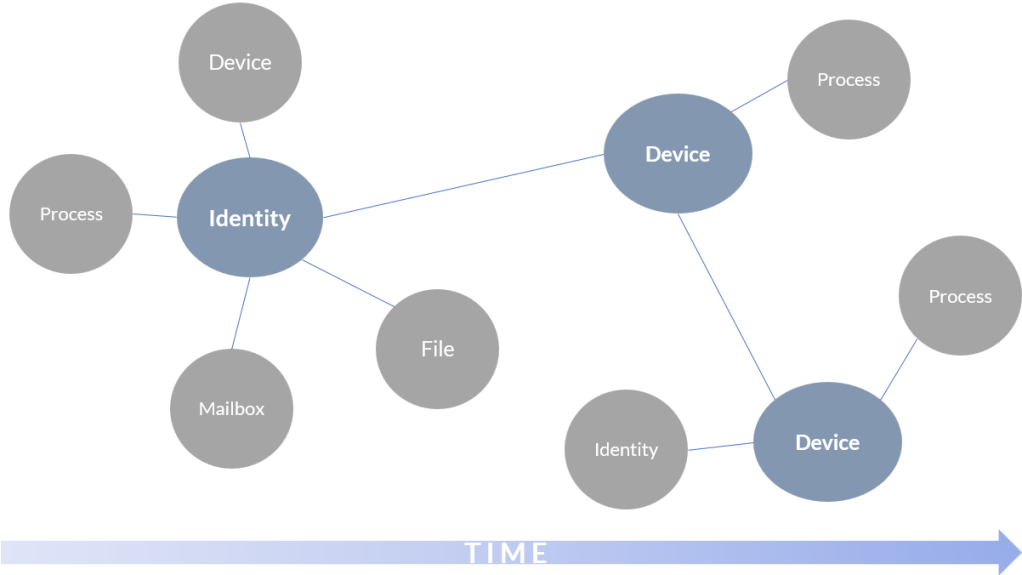
As in our everyday life, the interactions in these relationships take place in sequence, so time also plays a key role. With that we have an example of an incident story skeleton. Before we dive into the actual story, we need to prepare ourselves with one last skill – the skill to travel through time:
Time
Time might be an illusion from a universal perspective, however, if you NOW need to find out what happened earlier, time is essential. Whatever you are looking for, try to narrow it down to a specific period:
| where Timestamp > datetime(2022-03-22 22:00:34)OR
| where Timestamp between (datetime(2022-03-22 22:00:34)..datetime(2022-03-22 23:00:34))For more information about time handling in KQL, see Gianni’s post.
Entities
Now, to draw that incident story skeleton, we need a starting point – an entity mentioned in an alert.
We see, there is a brute force attack against a machine in our network and when we look at the top of the incident, the machine name is mentioned as well as the name of the involved user:
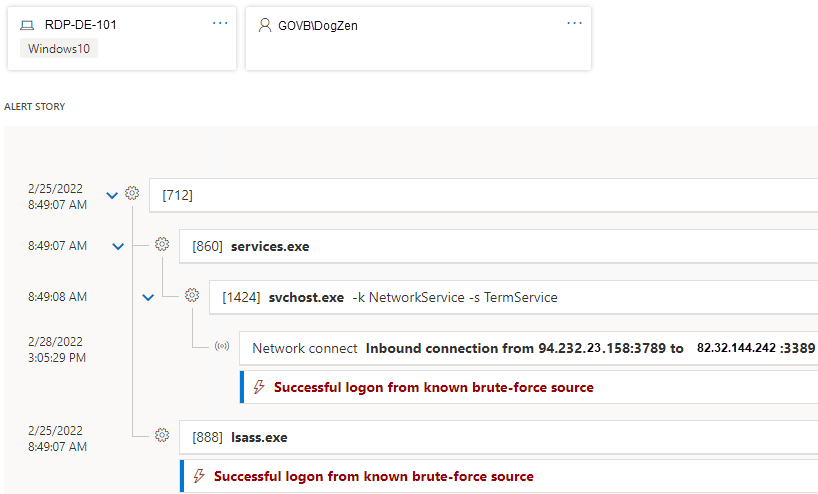
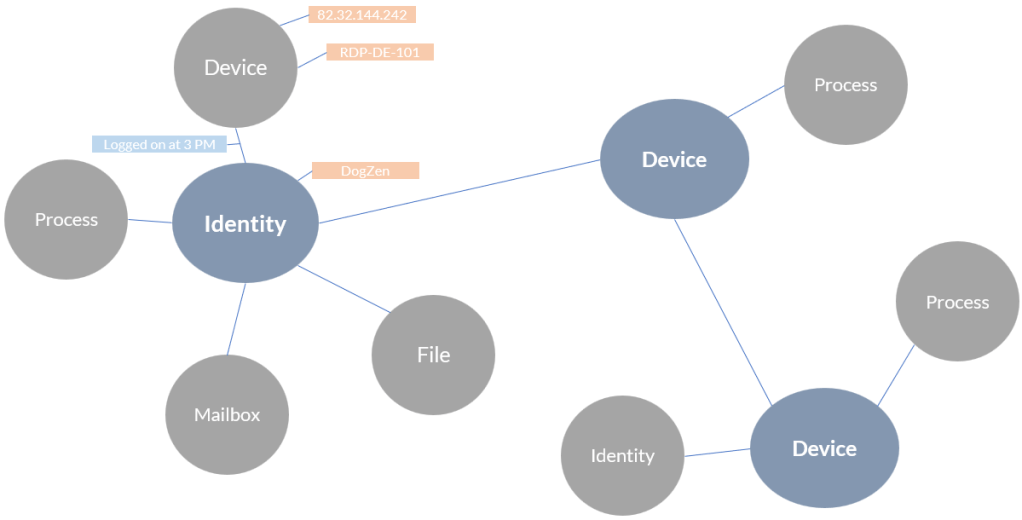
Here we have our starting points to draw the story graph. By the way – an alert is not the only starting point for hunting. Look back at the connected entity picture above: everything is connected! That means you just need one entity to start with.
We will start with the Identity entity mentioned in the Alert “DogZen”. To find further connections, we just need to hunt for other logons of this account in the given timeframe:
DeviceLogonEvents
| where AccountName == "DogZen"
| where Timestamp between (datetime(2022-02-28 22:55)..datetime(2022-02-28 23:55))
| distinct DeviceName
With that we get a list of all the devices, DogZen was logged on to and we can add these devices to our picture and connect them. Next, the other way round: Take the Device Name form the alert above and look, what other accounts have logged onto this device:
DeviceLogonEvents
| where DeviceName == "RDP-DE-101"
| where Timestamp between (datetime(2022-02-28 22:55)..datetime(2022-02-28 23:55))
| distinct AccountName
Properties
While you are hunting, do not forget to further expand the granularity of your incident story skeleton:
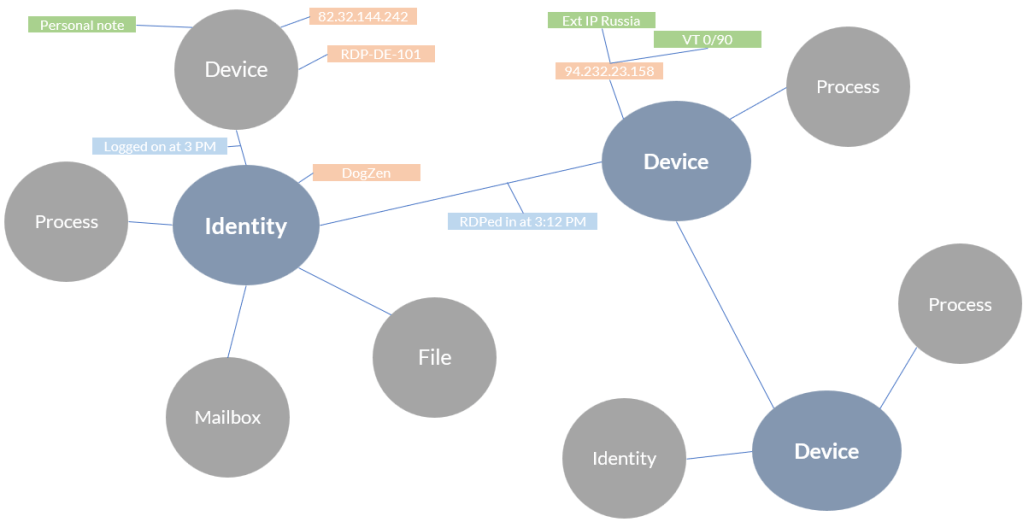
We also saw a source IP address in the alert – let’s now hunt for that and see what other devices had contact to that IP:
DeviceNetworkEvents
| where RemoteIP == "94.232.23.158"
Then there might have been other contacts from the same network range but from a different IP:
DeviceNetworkEvents
| where RemoteIP contains "94.232.23"
| where RemoteIP !startwith "194"
Again, we are adjusting, narrowing down our searches. The first where clause might brought up some F/Ps, so exclude them. Don’t just rely on the information MDE is providing. Also take greynoise, virustotal, ip-api.com or abuse.ch and many other sources into account. Kevin put up some of them here. And the guys from the blueteamblog have a very comprehensive post about useful tools here.
You might even think about using gundog – a PowerShell based hunting tool to integrate those external sources more easily.
Back to our story. We gathered new data that we can put into the picture:
Of course, you don’t have to literally write “Device” and the other entity names into your bubbles. I am doing this here to guide you through the process and I don’t want to change the initial picture for educational purposes. By the way: you can draw this story map on paper, use Miro or Mural or just something like PowerPoint. You might also look into tools like Aurora from Mathias. Whatever you do, work with assorted colors and forms to distinguish between, relationships, actions, different kind of properties etc.
Further with hunting. To check for other RDP connections from public IPs, from other IP adresses, do that:
let publicIPs = DeviceNetworkEvents
| where RemoteIPType == "Public"
| where InitiatingProcessCommandLine has_any ("TermService","termsvcs")
| project RemoteIP;
DeviceLogonEvents
| where RemoteIP in (publicIPs)
| summarize Failed = countif(ActionType == 'LogonFailed'),Success =  countif(ActionType == 'LogonSuccess'), totalip = dcount(RemoteIP ) by DeviceName, RemoteIP
| sort by Failed desc
Can you see what is happening here?
When you take the final picture (which we don’t have drawn yet), we are currently hopping from one bubble to the next. But we don’t know yet, where the next bubble is or what kind of entity it is. Remember Indy spelling “Jehovah”?

That is why with each new bubble we gain a firm stand on, we need to look around and forget all the assumptions we made before. If we first were only orientating on this Russian IP address, with this last query now that is looking for public RDP connections, we are letting go of the first assumption (Russian IPs) to not miss any circumstances.
However, we found out, there was only one successful login to a machine via RDP from a remote machine in Russia.
Next, we should ask ourselves what happened next. You could first do this focusing on the machine, the RDP connection was made to, or you could again broaden your view and hunt for malicious behavior globally in your environment. The following query is looking for processes that have been started from a PowerShell session and where the global prevalence of the process is quite low. You might have to adjust the values to your needs:
DeviceProcessEvents
| where InitiatingProcessFileName =~ "powershell.exe"
| where InitiatingProcessParentFileName != "Code.exe"
| invoke FileProfile()
| where GlobalPrevalence < 5000
| project FileName, AccountName, DeviceName, GlobalFirstSeen, GlobalLastSeen, GlobalPrevalence, Signer, SignatureState
Or you are interessed into download activities triggered by powershell
DeviceEvents
| where ActionType == "PowerShellCommand"
| where AdditionalFields contains "invoke-webrequest" or AdditionalFields contains "invoke-restmethod" or AdditionalFields contains "start-bitstransfer" or AdditionalFields contains "[System.Net.WebClient]"
| join DeviceProcessEvents on DeviceId
| where Timestamp1 between (Timestamp..datetime_add("minute",5,Timestamp))
| where InitiatingProcessParentFileName1 =~ "powershell.exe"
| invoke FileProfile(SHA2561, 100)
| where GlobalPrevalence < 10
| project FileName1, ProcessCommandLine1, InitiatingProcessCommandLine, InitiatingProcessCommandLine1, InitiatingProcessParentFileName, InitiatingProcessParentFileName1, GlobalPrevalence
Gather a few good repositories with useful hunting queries like these:
The more info you gather the messier our incident story dashboard gets. It’sa clever idea to introduce a new layer now to bring in more structure. Mitre ATT&CK helps us structuring the plot of an incident story:

Now, start classifying the entities, actions and properties in your dashboard according to MITRE:
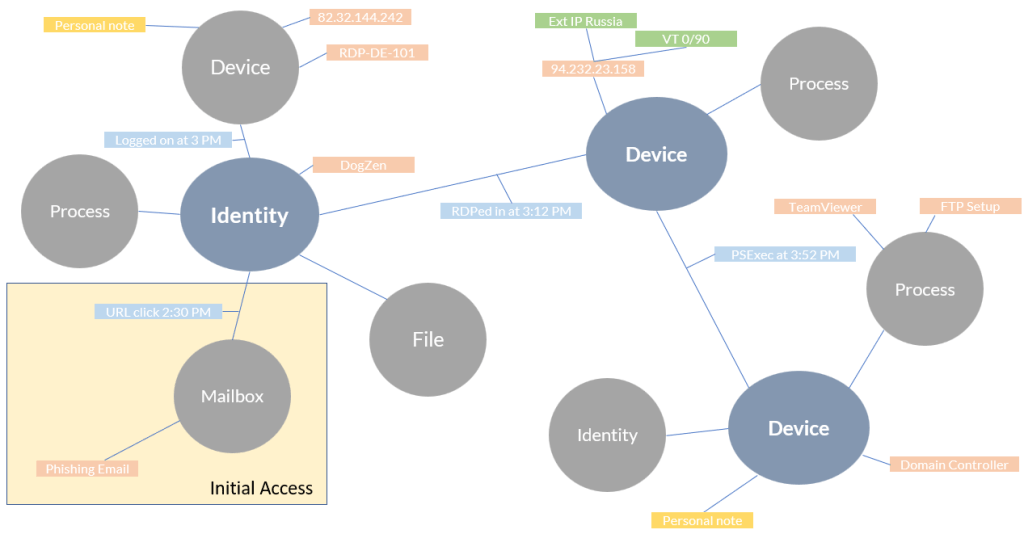
As you can see, it still looks kind of messy, because everything is so dense. I personally appreciate miro for exact that reason – you can perfectly zoom-in and out, work on details and get a global view.
Defender Tooling
Defender for Endpoint has its own capabilities in terms of visualization. First and foremost the incident graph:
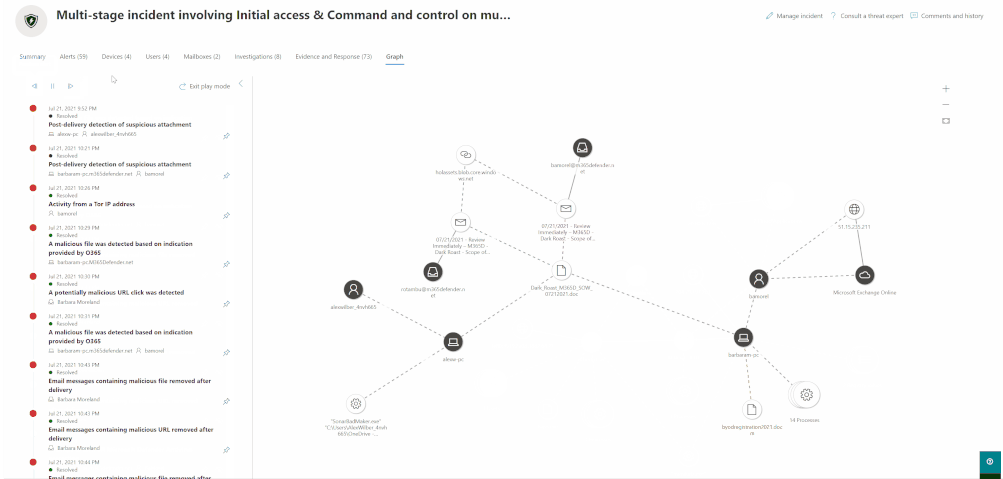
And you can even add your own hunting results to existing or to new incidents and then visualize them as well:
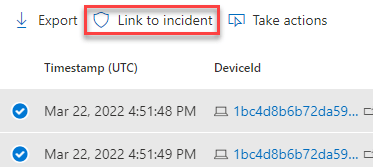
Of course, not always all the impacted entities of an incident are covered by MDE and in addition you want to add your own notes and additional enrichment information from other sources.
Conclusion
The main problem during hunting & investigation are the rabbit holes. Everybody knows those moments late in the night, where we find something interesting and then ask ourselves “why was I looking for that again, what does that mean now?”.
Being able to come up to the surface after each visit in ‘wonderland’ again to see the global perspective on our drawings, can help in such moments.

Pingback: Week 14 – 2022 – This Week In 4n6